Note
Go to the end to download the full example code.
Create grid masks from spatial shapes
The functionn pygmt.grdmask allows to create a grid mask based on spatial shapes
given as closed polygons. These polygons can be provided as numpy.ndarray or
geopandas.GeoDataFrame. For the nodes falling inside, outside, and on the
edges, different values can be defined. The created mask can then be applied to a
desired grid.
This value can be any number, or one of None, "NaN", and np.nan for NaN. The
defaults are 0 for outside, 0 for edge, and 1 for inside. To
treat edges as inside, use the same value as for inside. When setting these values,
keep in mind you are creating the mask grid first which is thought to be applied to a
real grid in a second step.
To create a land-water mask based on the GMT built-in shoreline data you can directly
use the function pygmt.grdlandmask explained in the gallery example
Create ‘wet-dry’ mask grid. As the focus of this
tutorial is on creating a mask grid and the related masked grid, no colorbars for the
elevation grids are added to the maps.
import geopandas
import numpy as np
import pygmt
from shapely.geometry import Point
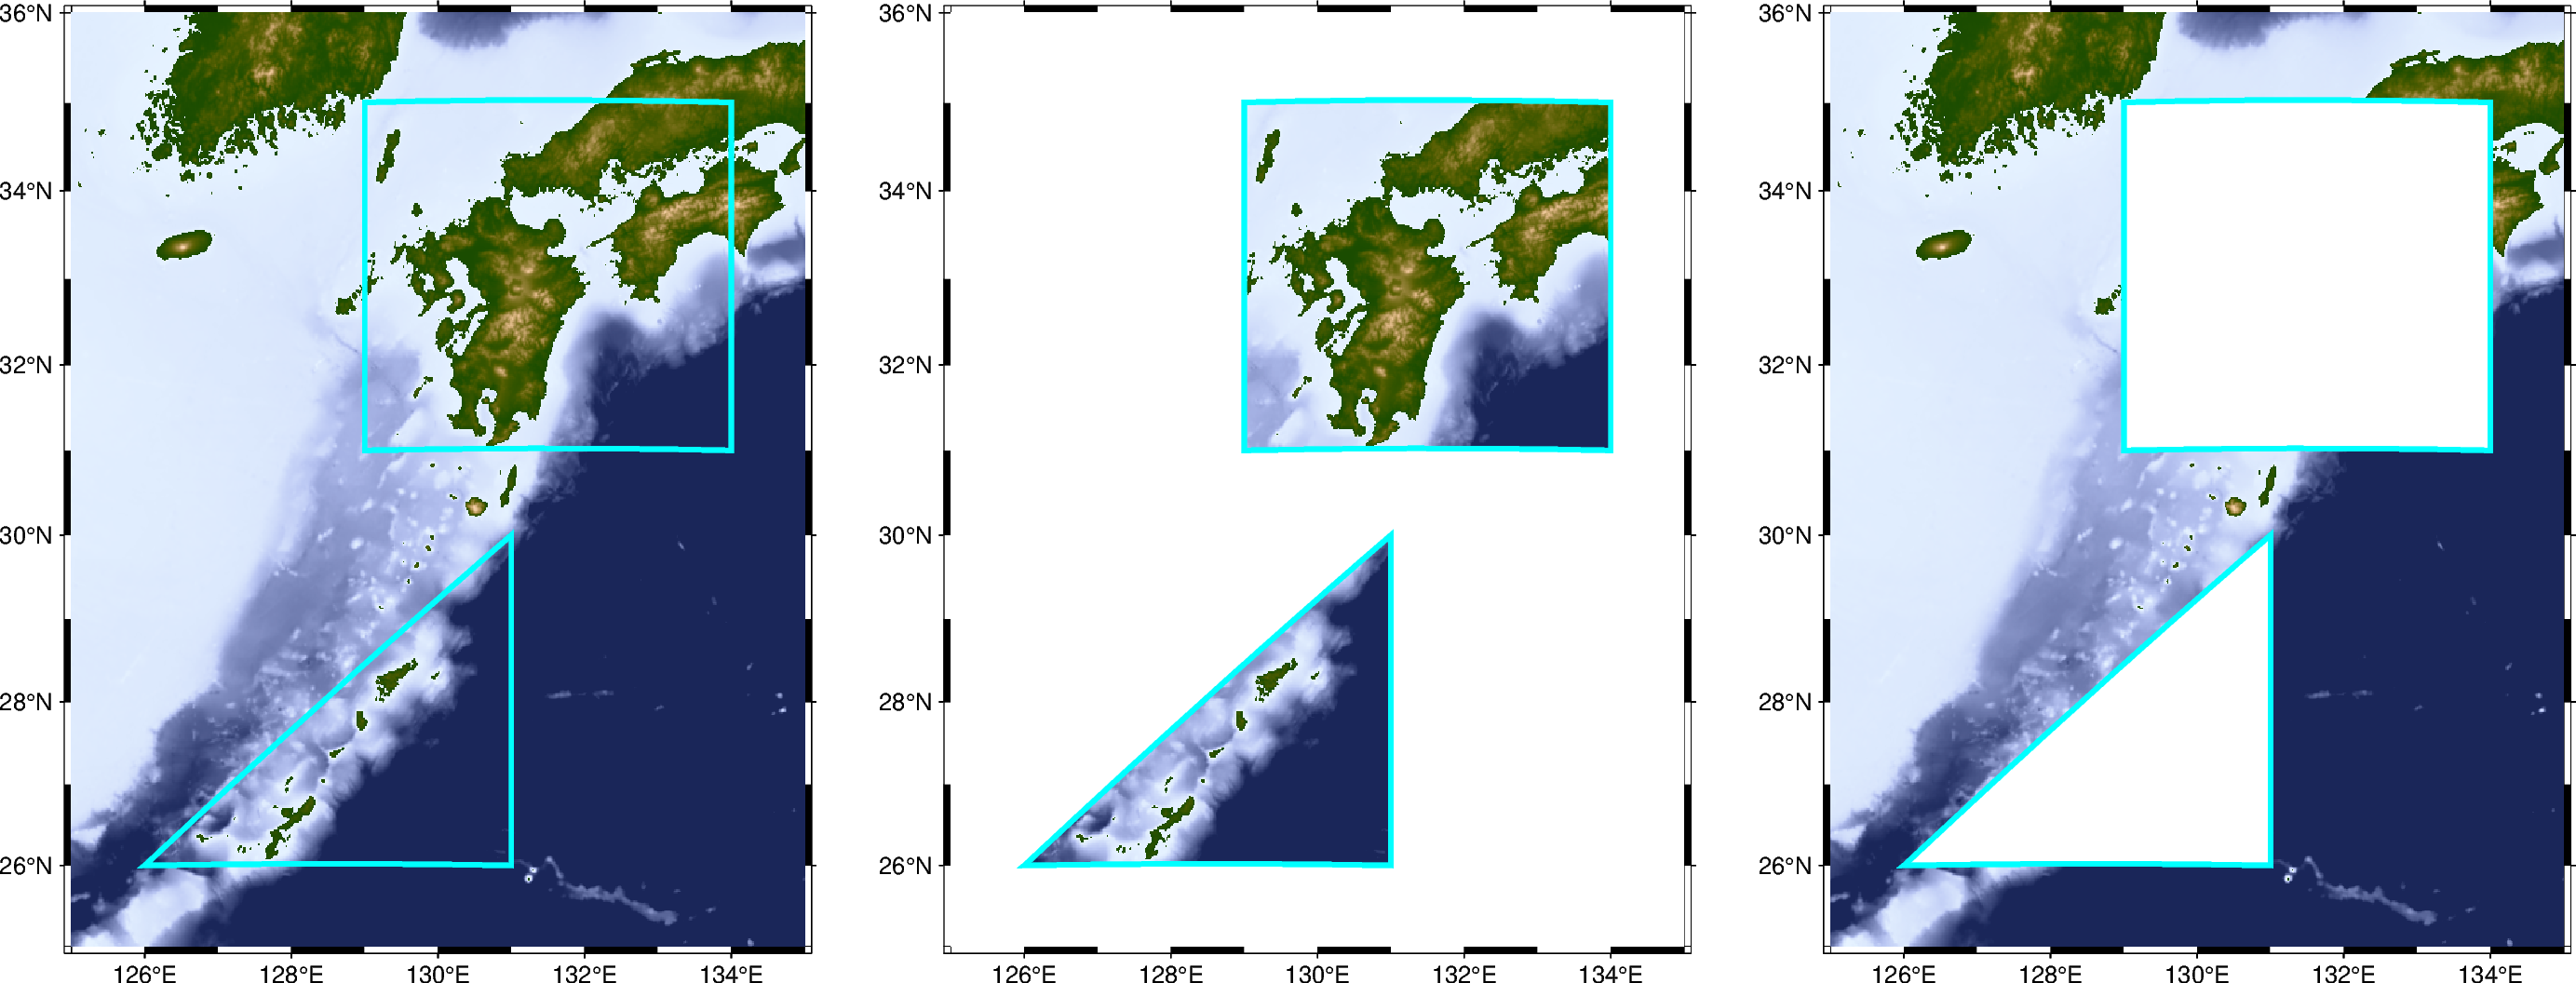
Polygons based on a numpy.ndarray
# Define a study region
region = [125, 135, 25, 36]

# Define two closed polygons, here a square and a triangle.
# Use a record with np.nan to separate the polygons
polygon = np.array(
    [
        [129, 31],
        [134, 31],
        [134, 35],
        [129, 35],
        [129, 31],
        [np.nan, np.nan],
        [126, 26],
        [131, 26],
        [131, 30],
        [126, 26],
    ],
)

# Download elevation grid
grid = pygmt.datasets.load_earth_relief(region=region, resolution="01m")

# Create a grid mask based on the two polygons defined above
# Set all grid nodes outside the polygons to NaN
mask_outside = pygmt.grdmask(region=region, data=polygon, spacing="01m", outside="NaN")
# Set all grid nodes inside the polygons to NaN
# Set the outside parameter to a value larger 0 to keep the nodes outside unchanged
mask_inside = pygmt.grdmask(
    region=region, data=polygon, spacing="01m", inside="NaN", outside=1
)

# Apply the grid mask to the downloaded elevation grid by multiplying the two grids
grid_masked_outside = grid * mask_outside
grid_masked_inside = grid * mask_inside


fig = pygmt.Figure()
pygmt.makecpt(cmap="SCM/oleron", series=[-2000, 2000])

# Plot the elevation grid
fig.basemap(region=region, projection="M10c", frame=True)
fig.grdimage(grid=grid, cmap=True)
fig.plot(data=polygon, pen="2p,cyan")

fig.shift_origin(xshift="+w+2c")

# Plot the masked elevation grid outside
fig.basemap(region=region, projection="M10c", frame=True)
fig.grdimage(grid=grid_masked_outside, cmap=True)
fig.plot(data=polygon, pen="2p,cyan")

fig.shift_origin(xshift="+w+2c")

# Plot the masked elevation grid inside
fig.basemap(region=region, projection="M10c", frame=True)
fig.grdimage(grid=grid_masked_inside, cmap=True)
fig.plot(data=polygon, pen="2p,cyan")

fig.show()
grdblend [NOTICE]: Remote data courtesy of GMT data server oceania [http://oceania.generic-mapping-tools.org]
grdblend [NOTICE]: SRTM15 Earth Relief v2.7 at 01x01 arc minutes reduced by Gaussian Cartesian filtering (5.2 km fullwidth) [Tozer et al., 2019].
grdblend [NOTICE]:   -> Download 30x30 degree grid tile (earth_relief_01m_g): N00E120
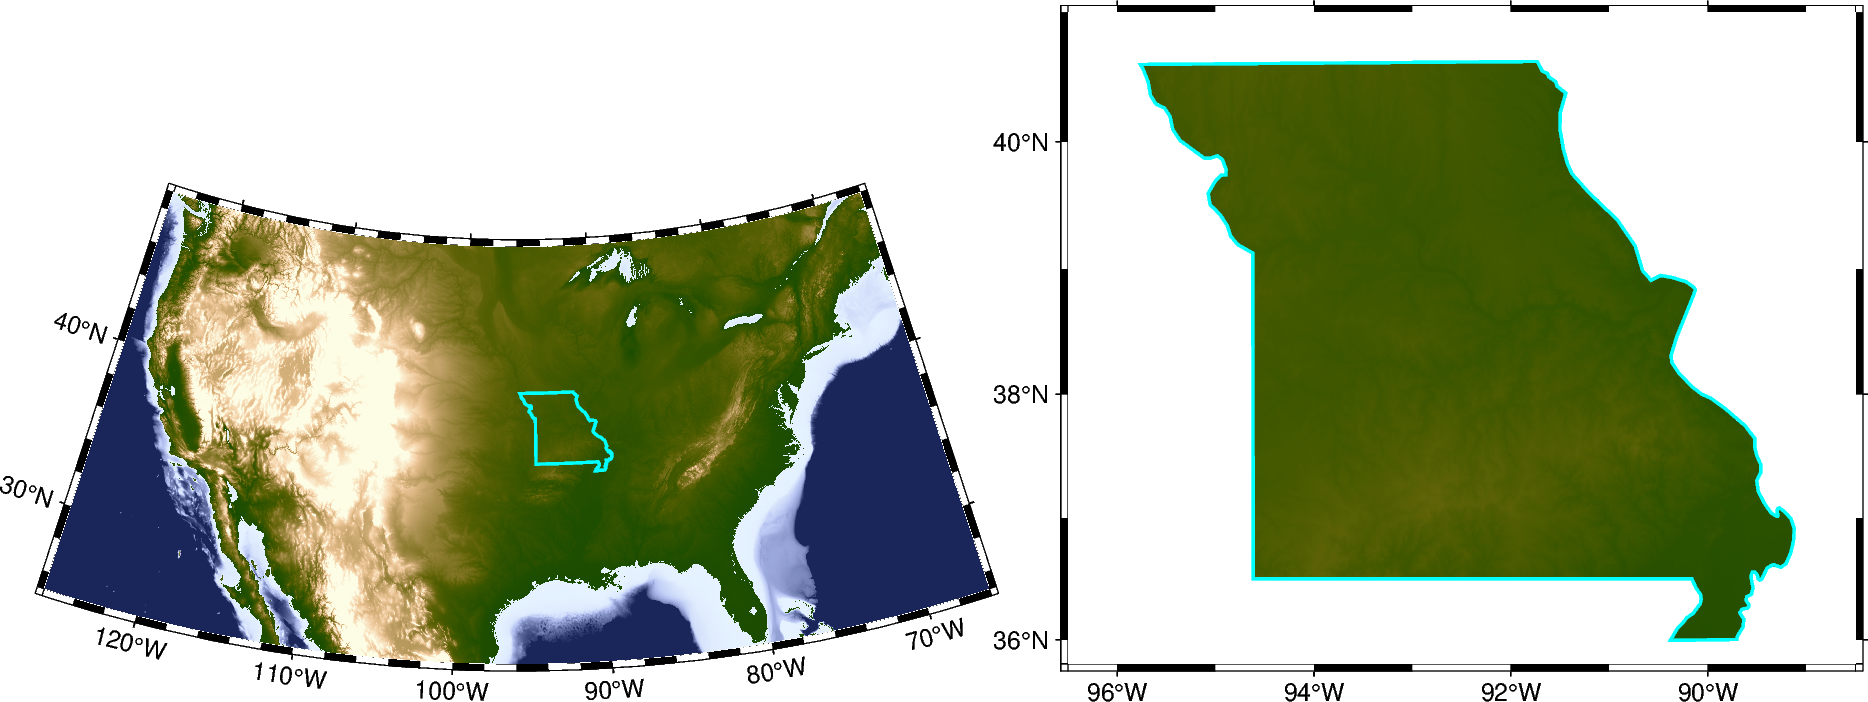
US state Missouri based on a geopandas.GeoDataFrame polygon geometry
region = [-126, -66, 25, 49]

provider = "https://naciscdn.org/naturalearth"
states = geopandas.read_file(
    f"{provider}/50m/cultural/ne_50m_admin_1_states_provinces.zip"
)
missouri = states[states["name"] == "Missouri"]

grid = pygmt.datasets.load_earth_relief(region=region, resolution="01m")
mask = pygmt.grdmask(region=region, data=missouri, spacing="01m", outside="NaN")
mask_lonlat = mask.rename(new_name_or_name_dict={"x": "lon", "y": "lat"})
grid_masked = grid * mask_lonlat


fig = pygmt.Figure()
pygmt.makecpt(cmap="SCM/oleron", series=[-2000, 2000])

# Plot the elevation grid
fig.basemap(projection="L-96/35/33/41/12c", region=region, frame=True)
fig.grdimage(grid=grid, cmap=True)
fig.plot(data=missouri, pen="1p,cyan")

fig.shift_origin(xshift="+w+1c")

# Plot the masked elevation grid
# fig.basemap(projection="L-96/35/33/41/12c", region=region, frame=True)
fig.basemap(projection="M10c", region=[-96.5, -88.5, 35.8, 41], frame=True)
fig.grdimage(grid=grid_masked, cmap=True)
fig.plot(data=missouri, pen="1p,cyan")

fig.show()
grdblend [NOTICE]: Remote data courtesy of GMT data server oceania [http://oceania.generic-mapping-tools.org]
grdblend [NOTICE]: SRTM15 Earth Relief v2.7 at 01x01 arc minutes reduced by Gaussian Cartesian filtering (5.2 km fullwidth) [Tozer et al., 2019].
grdblend [NOTICE]:   -> Download 30x30 degree grid tile (earth_relief_01m_g): N00W150
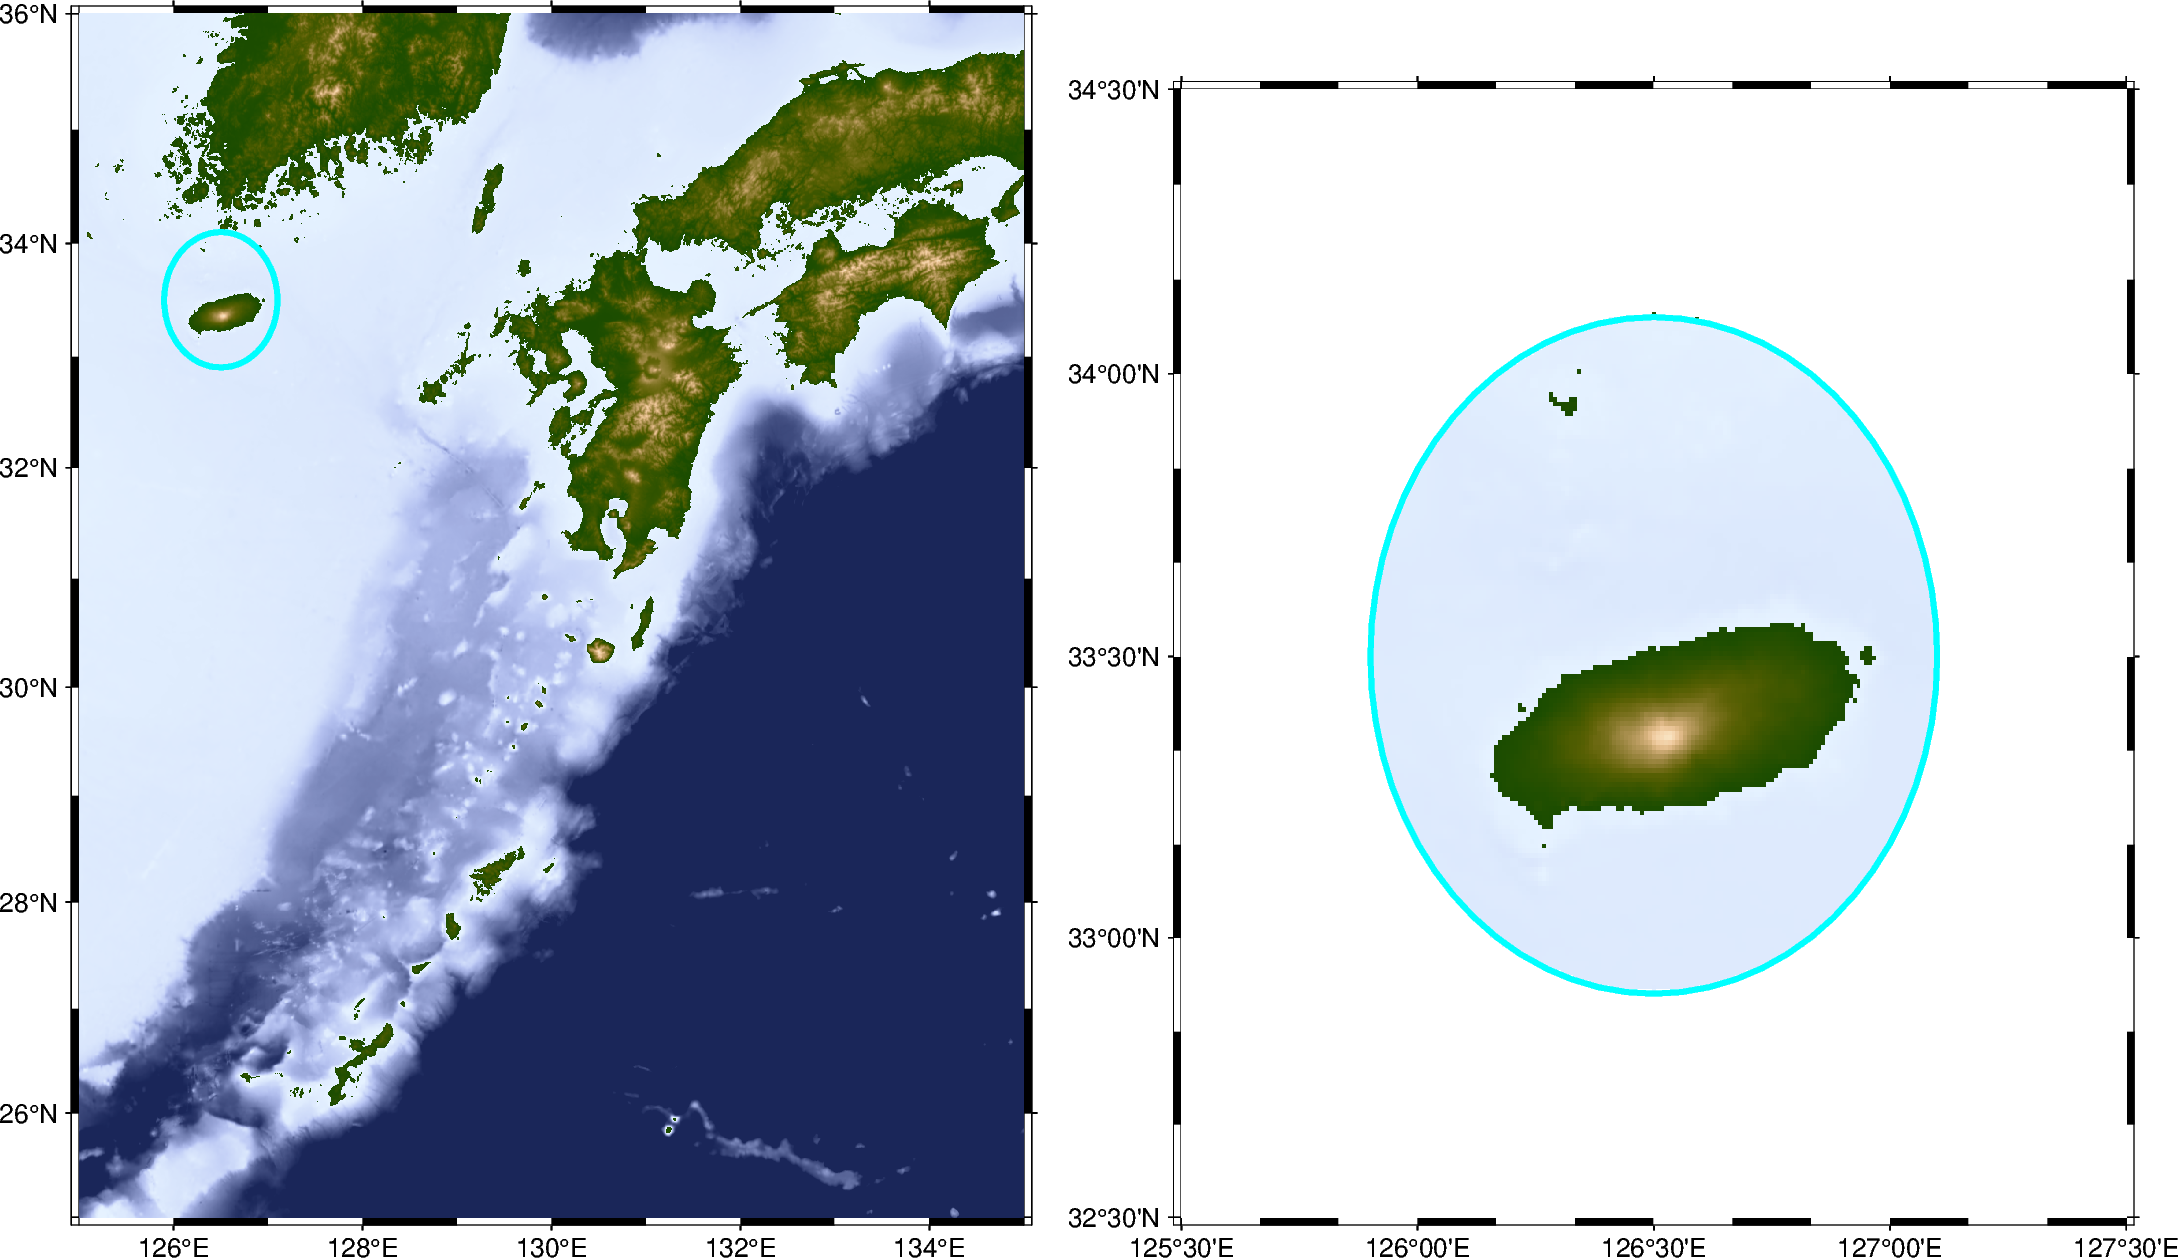
Circle based on GeoPandas polygon geometry
Note the distortion of the circle due the projection making it appear as an ellipse.
region = [125, 135, 25, 36]

# Create a point and buffer it
point = geopandas.GeoSeries([Point(126.5, 33.5)])
circle = point.buffer(0.6)  # 0.6 is the radius

# Create masked grid
grid = pygmt.datasets.load_earth_relief(region=region, resolution="30s")
mask = pygmt.grdmask(region=region, data=circle, spacing="30s", outside="NaN")
mask_lonlat = mask.rename(new_name_or_name_dict={"x": "lon", "y": "lat"})
grid_masked = grid * mask_lonlat


fig = pygmt.Figure()
pygmt.makecpt(cmap="SCM/oleron", series=[-2000, 2000])

# Plot the elevation grid
fig.basemap(region=region, projection="M12c", frame=True)
fig.grdimage(grid=grid, cmap=True)
fig.plot(data=circle, pen="2p,cyan")

fig.shift_origin(xshift="+w+2c")

# Plot the masked elevation grid
fig.basemap(region=[125.5, 127.5, 32.5, 34.5], projection="M12c", frame=True)
fig.grdimage(grid=grid_masked, cmap=True)
fig.plot(data=circle, pen="2p,cyan")

fig.show()
grdblend [NOTICE]: Remote data courtesy of GMT data server oceania [http://oceania.generic-mapping-tools.org]
grdblend [NOTICE]: SRTM15 Earth Relief v2.7 at 30x30 arc seconds reduced by Gaussian Cartesian filtering (2.6 km fullwidth) [Tozer et al., 2019].
grdblend [NOTICE]:   -> Download 15x15 degree grid tile (earth_relief_30s_g): N15E120
Total running time of the script: (0 minutes 38.854 seconds)